


I. Introduction
II. Related Work
III. Data
IV. Analysis
1. Network Scale
2. Degree Distribution
3. Centrality
4. Clustering and the Small-World Property
5. Community Detection
V. Conclusions
I. Introduction
The annual AAG meeting gathers hundreds of leading researchers, educators, students, and practitioners in geography. Thousands of research findings are presented at the conference every year. Although the AAG meeting coordinators organize presentations in sessions by subject matter, it is still difficult for scholars to quickly identify the meeting's major underlying topics and themes that may even span multiple sessions and subjects. Manual summarization of such large meetings by human experts is prohibitive and possibly subjective. In these scenarios, data mining techniques can effectively leverage such information to reveal suggestive patterns and to provide stakeholders and decision-makers with actionable knowledge. In this work, we attempt to portray the state of research and current interests within the field of geography as exposed by the 2020 AAG meeting. Typically, authors provide keywords to characterize the content of their research presentations. Networks of keywords can unveil overall academic interest centers and knowledge points in the research presented in the conference and presumably, by extension, in the field of geography.
We propose a systematic approach to summarizing the 2020 AAG conference presentations using keywords. Our adopted framework is network analysis, which is a sub-field of graph theory that leverages relationships between entities to create a holistic representation of a problem in the form of a network. This modeling technique allows the application of network algorithms to extract knowledge and reveal new information about the domain. Typically, networks encompass many connections that are otherwise incomprehensible. Through network properties (e.g., diameter, average shortest path, density, clustering, connectedness, degree distribution, centrality, etc.) various characteristics of a domain become exposed. Many fields benefit from such analyses, from business and legal to life sciences and education, as well as computer science and mathematics. Social domains have also been examined using networks and in recent decades, much interest has being geared towards social networks from online platforms like as Facebook, LinkedIn, Twitter, etc. We believe a network analysis approach utilizing keywords is suitable for the domain of geographic research, which is highly interdisciplinary in nature and novel or emerging associations of keywords may be very informative. Although we only focus on a single conference in this work, AAG is one of the largest meetings in the field. Furthermore, conferences arguably depict a rather instantaneous snapshot of the research conducted, as opposed to journals or books, where articles have a longer turnover time.
Our objective is thus to extract and visualize the knowledge embedded in the keyword network of the 2020 AAG presentations. We reveal the structural organization of keywords by investigating network characteristics and the scale-free connectivity of terms. The roadmap of this article is as follows: we briefly discuss related literature in Section 2. We describe the 2020 AAG dataset and the preprocessing steps in Section 3. Our analysis of this dataset, a description of the methodologies, and pattern visualizations accompanied by discussions of our findings, can be found in Section 4. Finally, we conclude our work in Section 5.
II. Related Work
Scientific literature is a domain that has been extensively explored using network analysis. Matusiak and Morzy (2012) are studying the underlying structure of scientific collaborations. Sun et al. (2011) show how by building co-authorship networks, “bridges” between research groups can be determined and new successful collaborations, venues, and even topics can be recommended. Networks of keywords have been studied in the engineering literature (Kim et al., 2021), management information systems journal articles (Choi et al., 2011), computer science research (Park et al., 2012), research on tourism service quality (Park and Jeong, 2019), etc. To study the structure of the evolutionary economic geography field, Zhu et al. (2019) explore the transformation of a keyword co-occurrence network and a reference co-citation network of publications.
Network analysis has been extensively explored in relation to geographic sciences (Curtin, 2007). Melo and Queiroz (2019) made a bibliometric mapping of 2,053 scientific papers on Geographic Information Systems (GIS) published between 2007 and 2016 in twenty journals of the Web of Science Core Collection.
Centrality is a powerful measure in analyzing large graphs and has become a popular tool in a wide range of disciplines. For instance, betweenness centrality was used by De la Pena Sarracen and Rosso (2018) for natural language processing (NLP). The authors leveraged betweenness centrality in extractive text summarization by constructing a network of sentences, where each node corresponds to a sentence and the weight of an edge was calculated using a similarity score between sentences, represented as bags-of-words. Only edges satisfying a certain threshold were kept in the final graph and based on the computed betweenness centrality metric, the most important sentences were identified to be part of the inferred summary. The results were comparable to the ones of more established algorithms used in NLP for text summarization.
Also known as six degrees of separation, the small-world phenomenon is a theory stating that anyone is connected through a chain of acquaintances with any other person in the world through roughly six other people. This fundamental principle is explained by the fact that in a social network there is an abundance of short paths and tight communities. The small-world property manifests in many domains and most real networks are characterized by such topological features. For example, Zhu et al. (2013) show that the small-world effect is also present on a network of keywords from Elsevier's abstract and citation database, called Scopus. The authors further explore how such a network leads to the discovery or “hotspots” in a discipline
III. Data
Our dataset comprises the keywords of all the 4893 publications from the 2020 AAG conference (last browsed 02-022020). These keywords are selected by authors to describe their work and can range from single words to complicated phrases and abbreviations, and from broader, frequent terms to more unique, or rare words, specific to that research. After a closer look at the highly frequent terms, it became apparent that multi-word keywords required consolidation, such as splitting them into single words, and thus keywords like urban, urban community, urban big data, urban planning were changed to urban, community, big.data, and planning, respectively. In total, 21,954 keywords were processed into single-word keywords and any duplicate words from each record (article) were deleted. After careful lemmatization, additional manual cleaning (such as fixing typos) and standardization, a total of 6,521 unique keywords were identified. Table 1 lists the most frequent keywords and most common co-occurrences (i.e., largest edges).
Finally, we built the 2020 AAG network using keywords as nodes and connected two nodes if the corresponding keywords occur together in an article.
Table 1.
Most common keywords and most common keyword co-occurrences (edges)
IV. Analysis
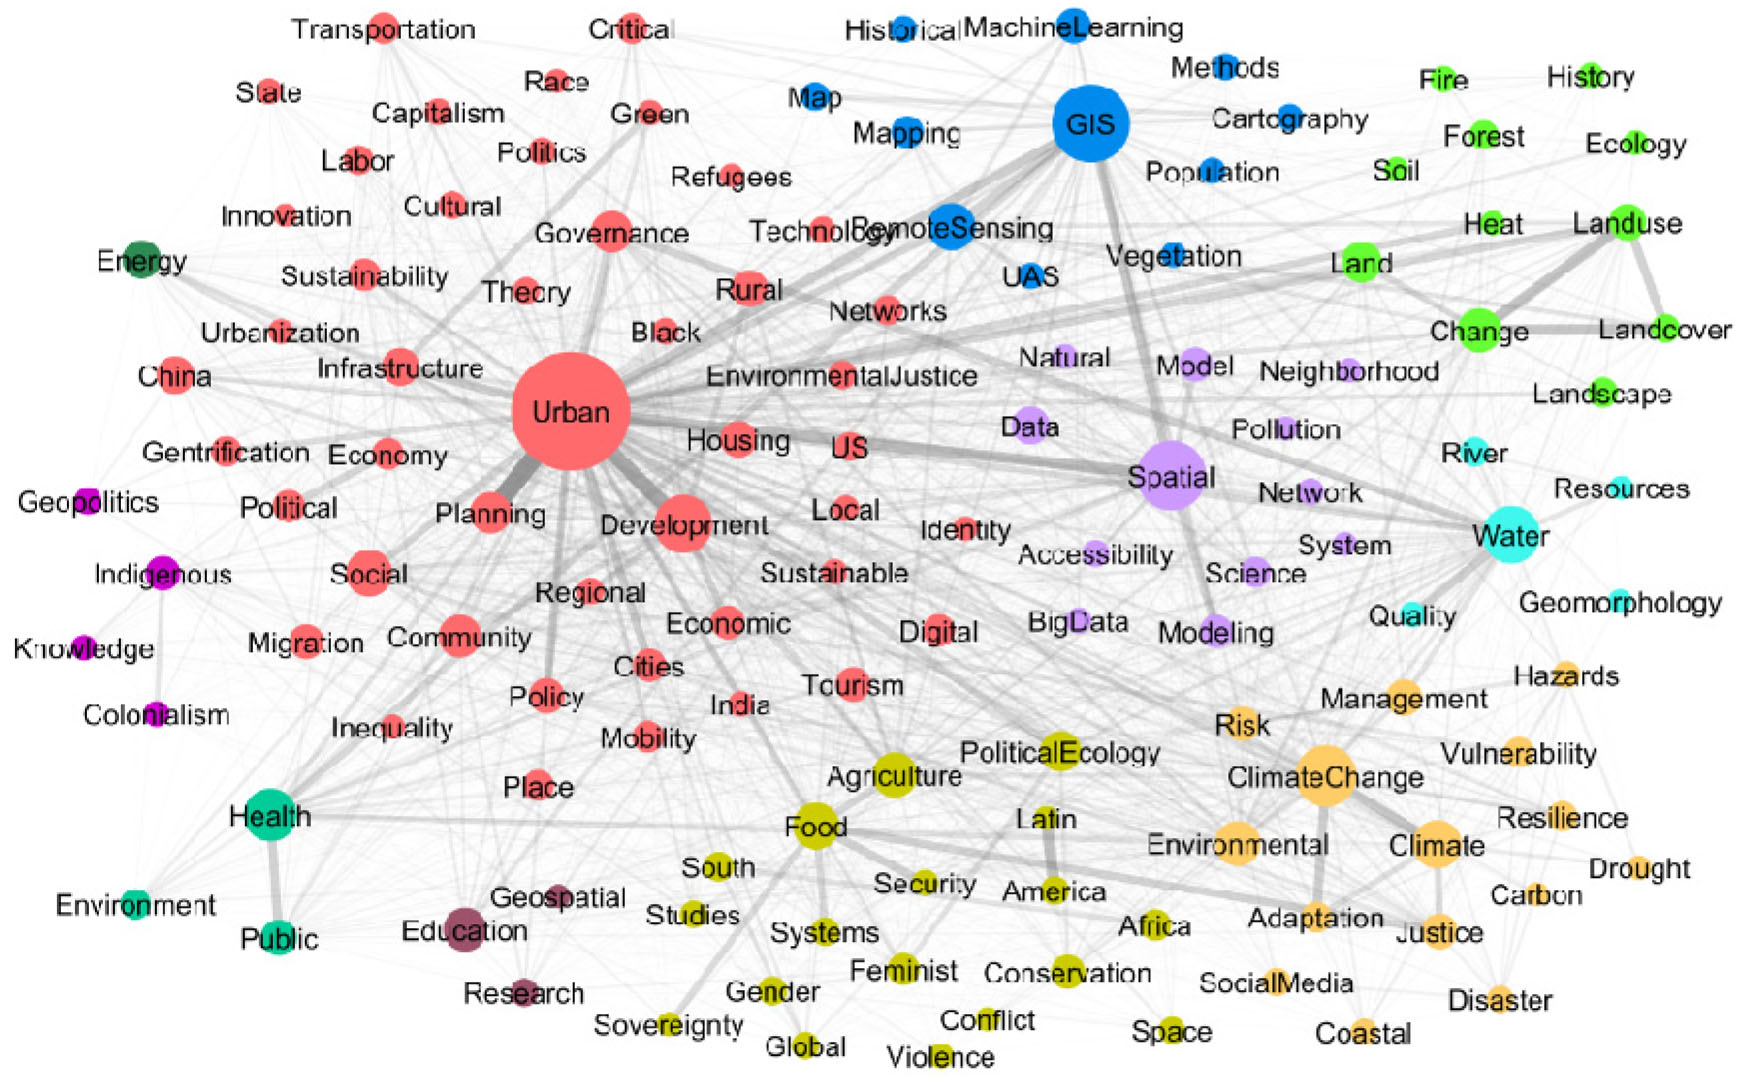
We computed several well-defined and widely used measures to better understand the properties of the 2020 AAG keywords from a network-level perspective as well as a node-level perspective. A summary representative of the network can be observed in Figure 1. Only for the purpose of generating the figure, we set the frequency threshold at 40 for better visualization, yielding a total of 129 keywords whose frequencies were higher. In the figure, circle sizes reflect keyword frequencies, edge widths are directly proportional to the number of co-occurrences between two keywords, and circle colors indicate cluster memberships, which are discussed in Section 4.5.
1. Network Scale
Three important large-scale properties of networks are the diameter (linear size of the network), the average shortest path (geodesic distance) between all pairs of nodes, and the density of the network. These global measures characterize how quickly information or ideas can spread across the network or how quickly they can travel from one node (or part of the graph) to another node (or another part of the graph), by quantifying how close nodes are to each other.
1) Diameter
The 2020 AAG keyword network has a diameter of 6 (i.e., six hops), denoting the degree of information dispersion of the network. Figure 2 shows the keywords involved in diameters, some of which belong to the same paper (as shown by a direct connection). For example, nodes participating in the diameter that connects yeast to Skopje are: yeast, biology, systems, political.ecology, nationalism, Macedonia, and finally, Skopje. These are keywords that have lower level of interaction with the rest of the more concentrated terms.

2) Average Shortest Paths
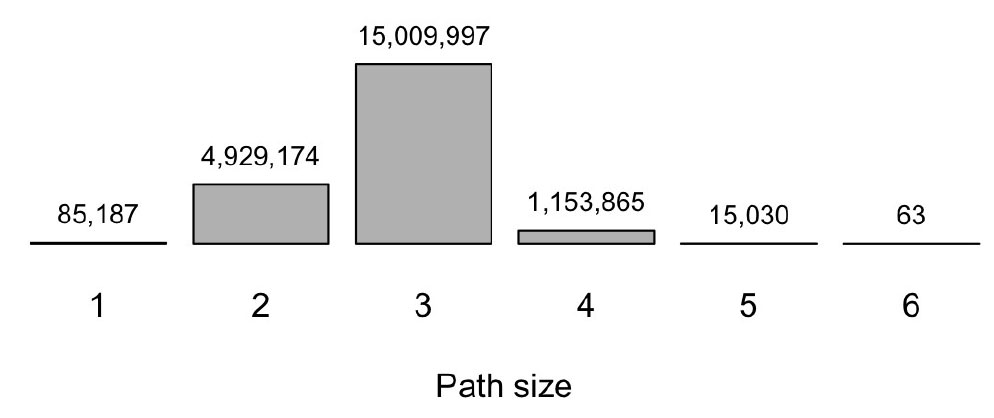
The AAG keyword network's average shortest (geodesic) path is 2.812. See Figure 3 for the entire distribution. This finding is not surprising, as many real networks show similar characteristics, despite the relatively large number of constituent nodes. For instance, the average path length of co-authorship networks ranges from 4.6 to 7.6, depending on the domain (e.g., biology, physics, math) (Newman, 2004), while Facebook's social network has a mean path length of 4.7 for its staggering 721 Million members and 69 Billion friendship connections (Backstrom et al., 2012).
The keyword network constructed from library and information science articles in Scopus exhibits an average distance of 4.2 among its reachable pairs (Zhu et al., 2013). The keyword networks of academic papers in computer science have average distances ranging from 2.9 to 7 for network sizes from 17K to 1.3K. (Park et al., 2012).
3) Density
Network density is a statistic defined as the ratio of actual to potential connections (keyword co-occurrences in this case). The 2020 AAG keyword network has a density of approximately 0.04% (0.004043) as opposed to a fully connected network where each node is connected to every other node, in which case the network has a density of 100% (1.00). Density is an indicator of efficiency, as a high-density keyword network potentially enables ideas to propagate faster as it better exploits co-occurrences. The AAG keyword network is not very dense which can possibly mean that the research presented is spanning many subjects and comprises a considerable number of interdisciplinary articles. Other fields have similar densities. In computer science, the network of keywords from scientific publications also shows densities between 0.08% to 0.24%, varying with the period analyzed (Park et al., 2012). Keyword networks from domains such as LED (Light Emitting Diode) and wireless broadband fields are also connected sporadically, and exhibit comparably low densities. (Choi and Hwang, 2014).
2. Degree Distribution
The degree of a node is the total number of links incident on the node. The structure of the network in terms of node degrees provides insight into how information and ideas diffuse or propagate across the network. In real world networks, most nodes have a relatively small degree, while a few nodes will have very large degree, being connected to many other nodes. The degree distribution of our 2020 AAG keyword network is given in Figure 4. The highest degree nodes are listed in the first column of Table 2, where urban, GIS, and spatial are the top hubs, which also have the highest frequency of occurrence.
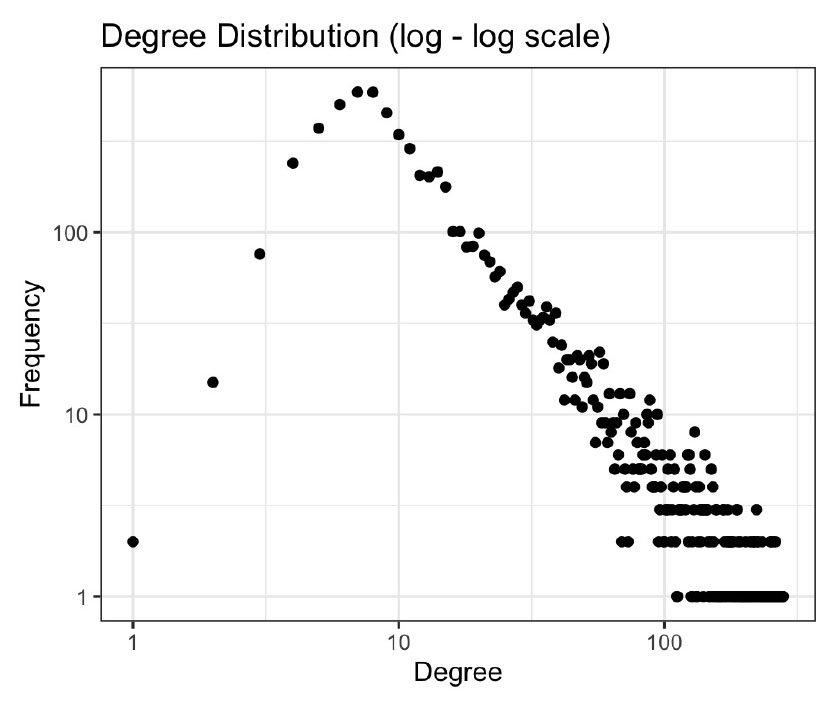
Table 2.
Various centrality values of the most important keywords in 2020 AAG
3. Centrality
The notion of centrality originated in social network analysis, and it is an important structural property of a node. By measuring a keyword's betweenness centrality, the most powerful vertices in the network can be identified. A classification of a variety of centralities and other derived measures can be found in study of Freeman (1978). In a keyword co-occurrence network, the centrality index can expose critical keywords, which indicate knowledge points in the 2020 AAG articles. Table 2 lists the keywords with highest centralities, revealing that urban, GIS, and spatial are consistently the focal points of interest in 2020. The remaining keywords overlap considerably showing that the centrality measures are generally positively correlated with each other for this dataset.
1) Degree Centrality
The degree centrality is a local property which simply reflects the number of links incident upon a node and thus shows which nodes are most connected or have the most direct neighbors. In our case, urban is the keyword that appears along with the widest variety of terms, followed by GIS and spatial.
2) Betweenness Centrality
Betweenness regards a node as a “bridge”, and measures how a node acts in the process of mediation. A node with high betweenness centrality has a high probability of appearing in the shortest path between any two nodes chosen uniformly at random and thus indicates the potential of a node to influence and even control communication because information must flow through it to reach other nodes. It is interesting how climate change has the highest “reputation” after the big three terms, while its degree is relatively lower than, for example, the degree of development.
Another measure, namely closeness centrality, is related to betweenness centrality as both are defined in terms of shortest paths. A node with high closeness is generally interpreted as having efficient access to other nodes, while a node with high betweenness has more control over others' communication. Since closeness can only be computed for connected graphs, we calculated closeness for the biggest sub-graph (i.e., largest connected component) of 2020 AAG. There was a total of four connected components, with the following sizes: 6483, 1, 1, 2. The biggest subgraph absorbed most of the keywords. The second and third sub-graphs are individual papers that have only one keyword (phrase): REDD and human disaster, respectively. Interestingly, REDD+ occurs four times. The last disconnected component, a two-node sub-graph, is represented by rock climbing, again a single article.
The top seven keywords with highest closeness centrality are the same as the ones with highest eigenvector centrality, and for this reason were not added to the table. The remaining three keywords were health, social, climate. The consistency between closeness and eigen centrality further substantiates the overall importance of these terms.
3) Eigenvector Centrality
Eigenvector centrality takes the idea of degree centrality one step further, by ranking connections to important nodes (as measured by degree centrality) higher than connections to less important ones. Therefore, a node with high eigenvector centrality may not necessarily be highly linked, but may just be connected to few other very important nodes. A variant of eigenvector centrality is at the core of Google's PageRank algorithm, used to rank web pages based on their authority and importance, not just on the number of incoming edges (i.e., other pages pointing to it).
We found urban to be the most influential keyword of 2020, having the highest eigenvector centrality value. This evidence further reassures the fact that urban has influence over the entire network, not just over the keywords directly connected to it. Interestingly, development and climate change switched places from betweenness centrality, which can be interpreted as development having stronger network-level influence, while climate change is responsible for easier control over collaborations among research topics.
4. Clustering and the Small-World Property
The clustering coefficient (aka transitivity), based on triplets of nodes, indicates the degree to which nodes in a network tend to cluster together. From a keyword network standpoint, it is the probability that two of a keyword's co-occurring keywords will also occur together in a different article. The average local clustering coefficient (or partial transitivity) of the 2020 AAG keywords network is 0.736. The global clustering coefficient (or global transitivity) is 0.12 showing that such co-occurrences are relatively dense, and much higher (about 40 times higher) than the ones occurring in random Erdos-Renyi networks (Erdos and Renyi, 1960) with the same characteristics (number of nodes and edges). The reason local transitivity is greater than global transitivity, is because it gets dominated by keywords with low degrees: a keyword with only two co-occurrences that are connected to each other has local clustering coefficient of one. This trend is not uncommon for real networks. For instance, the collaboration (co-authorship) network in computer science, has a local clustering of 0.75, and a global transitivity of 0.24 (Franceschet, 2011).
Networks with low transitivity show a behavior that is typical of the “small-world” phenomenon, also known as “six degrees of separation,” in popular culture. These networks have a surprisingly short geodesic distance relative to the number of nodes of the network. This phenomenon implies the scale-free (power-law) feature and networks having the small-world property also exhibit a self-organized evolution. In our case, this can be interpreted as authors showing a preferential selection of certain keywords, and of certain topics. The preferential attachment model, in the sense that edges (co-occurrences) are formed “preferentially” between keywords that already have high popularity, describes how keywords continue to amass larger degrees. The probability of getting new links - other new papers where authors are researching the same topic - also gets larger, analogous to the “rich get richer” phenomenon. AAG in 2020 shows that as keywords get utilized by many distinct researchers, they start to become more likely to continue to increase their degrees, in other words, they gain popularity.
5. Community Detection
Finally, we were interested in the community structure displayed by the keyword network. Communities (or clusters) comprise nodes that have higher probability of being connected to each other than to keywords from other communities. In this work, we used the Louvain (Blondel et al., 2008) algorithm, which was previously shown to work well on geography keyword datasets (Lee et al., 2020). This heuristic algorithm employs an iterative approach and relies on the optimization of modularity, a metric that quantifies the intra-cluster density of connections compared to the inter-cluster density. In the keyword network from Figure 1, we assigned color groups to nodes as indicated by the Louvain algorithm.
Twelve main relevant clusters were detected as shown in Table 3 along with the number of constituent keywords and the cluster influence over the network. The urban cluster has the largest number (1,522) of keywords as members. When the influence of each cluster was measured with the eigenvector centrality, the urban cluster was also the most influential, by controlling 28.12% of all possible communications (associations) among keywords. Interestingly, the GIS and spatial data science are separate, self-sustaining clusters. GIS remains an authoritative theme and the identification of GIS-specific research trends is an important and interesting problem on its own (Lee et al., 2019).
Table 3.
Clusters of 2020 AAG
Analyzing only the urban-referencing articles, eleven relevant sub-clusters were identified, and their member keyword counts, and percent of influences are shown in Table 4. No topic stands out within the urban research. Rather, several topics are very competitive, GIS and land use, and planning and resilience.
Table 4.
Sub-clusters of urban research
V. Conclusions
This study provides a systematic analysis of the keyword co-occurrence network of the AAG papers published in 2020. We have shown that network-based approaches represent a viable solution to mining this dataset, and the general steps taken in this work can also represent a methodology for tackling keyword networks from other domains. Our goal was to better understand the current state of research in geography and during our analysis, we have discovered several interesting features.
1.Terms like urban, GIS, and spatial have received much attention in 2020, and research revolving around urban has become a solid sphere of interest, transcending urban geography to include GIS, data science and modeling, land use and land cover, water, ecology, and environmental health.
2.The 2020 AAG keyword network does not fit the characteristics of random graphs, and in fact, exhibits the small-world property. It is likely that popular keywords will continue to influence the topics researched by AAG contributors in the following years.
3.The Spatial Data Science theme is now independent of the GIS theme, and approximately twice as influential a cluster.
Our preliminary results represent a steppingstone towards revealing a more comprehensive landscape of the research presented at AAG over the years. In future work, we plan to examine a span of 20 years of scientific articles from AAG, with the goal of finding research hot-spots, shifts, and trends in methodologies and frameworks over time, as well as their impact on previous research. Especially in the light of the small-world property of the 2020 AAG network, it is interesting to note that the 2020 most influential research topics were maintained at AAG 2021 as well. However, COVID-19 has emerged as the most researched topic in 2021 (Seong et al, 2021). Remains to be seen if the most popular keywords will continue to drive the evolution of the network and the progression of the Geography research.
One limitation regarding the dataset used in this work is that it is solely AAG-based. A more ample dataset including additional scientific publications from other venues can potentially unveil a more comprehensive and accurate picture. Eventually, by detecting changes in topological properties of keyword networks over the years, further findings can be used to identify emerging research areas and to help design more relevant academic curricula.